Kể từ bây giờ chúng tôi là Elev8
Chúng tôi không chỉ là một nhà môi giới. Chúng tôi là một hệ sinh thái giao dịch tất cả trong một—mọi thứ bạn cần để phân tích, giao dịch và phát triển đều có ở một nơi. Sẵn sàng nâng tầm giao dịch của bạn?
Chúng tôi không chỉ là một nhà môi giới. Chúng tôi là một hệ sinh thái giao dịch tất cả trong một—mọi thứ bạn cần để phân tích, giao dịch và phát triển đều có ở một nơi. Sẵn sàng nâng tầm giao dịch của bạn?
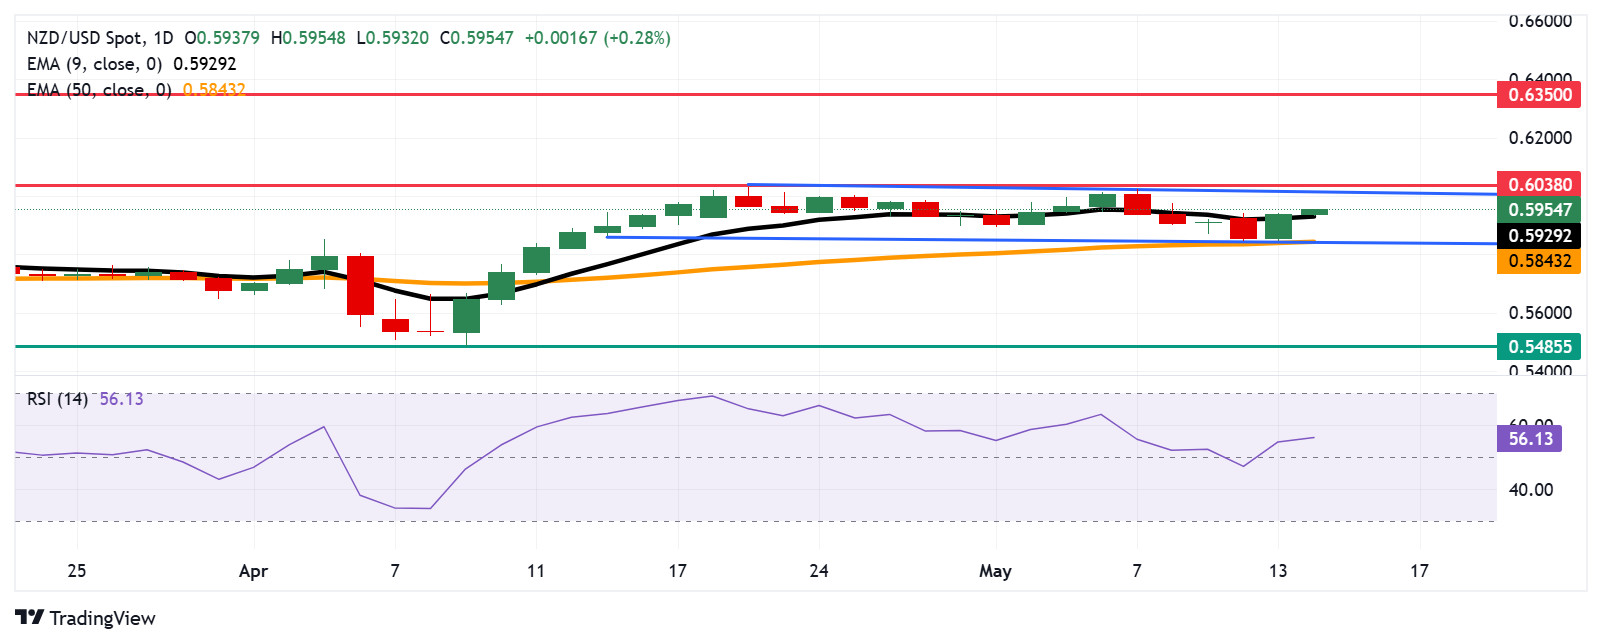
The NZD/USD pair holds gains after registering approximately 1.50% gains in the previous session, trading around 0.5940 during the European hours on Wednesday. The technical analysis of the daily chart indicates a neutral stance, as the pair continues to consolidate within a rectangular range.
However, the 14-day Relative Strength Index (RSI) has climbed above the 50 level, hinting at a developing bullish bias. Moreover, the NZD/USD pair remains above the nine-day Exponential Moving Average (EMA), pointing to strengthening short-term upward momentum.
The NZD/USD pair could target the rectangle’s upper boundary around 0.6020, followed by the six-month high of 0.6038, last seen in November 2024. A break above this crucial resistance zone could open the doors for the pair to explore the region around the seven-month high near 0.6350, recorded in October 2024.
On the downside, the NZD/USD pair may test its initial support at the nine-day EMA of 0.5929. A break below this level would weaken the short-term price momentum and put downward pressure on the pair to retest the initial support at the lower boundary of the rectangle around 0.5850, aligned with the 50-day EMA at 0.5843. A sustained move below this key support zone could further deteriorate medium-term momentum, potentially exposing the pair to a deeper decline toward 0.5485 — a level last seen in March 2020.
The table below shows the percentage change of New Zealand Dollar (NZD) against listed major currencies today. New Zealand Dollar was the strongest against the US Dollar.
| USD | EUR | GBP | JPY | CAD | AUD | NZD | CHF | |
|---|---|---|---|---|---|---|---|---|
| USD | -0.41% | -0.29% | -0.72% | -0.11% | -0.33% | -0.30% | -0.36% | |
| EUR | 0.41% | 0.12% | -0.25% | 0.29% | 0.09% | 0.10% | 0.04% | |
| GBP | 0.29% | -0.12% | -0.37% | 0.17% | -0.03% | -0.03% | -0.09% | |
| JPY | 0.72% | 0.25% | 0.37% | 0.54% | 0.32% | 0.34% | 0.27% | |
| CAD | 0.11% | -0.29% | -0.17% | -0.54% | -0.22% | -0.18% | -0.25% | |
| AUD | 0.33% | -0.09% | 0.03% | -0.32% | 0.22% | 0.02% | -0.04% | |
| NZD | 0.30% | -0.10% | 0.03% | -0.34% | 0.18% | -0.02% | -0.08% | |
| CHF | 0.36% | -0.04% | 0.09% | -0.27% | 0.25% | 0.04% | 0.08% |
The heat map shows percentage changes of major currencies against each other. The base currency is picked from the left column, while the quote currency is picked from the top row. For example, if you pick the New Zealand Dollar from the left column and move along the horizontal line to the US Dollar, the percentage change displayed in the box will represent NZD (base)/USD (quote).